Stock Analysis with Wolfram Mathematica – Part 2
In the previous article, I had explained how to get started using Wolfram Mathematica’s stock analysis features. The focus was on working with the exchanges supported by Mathematica, for example BSE India.
What if we have stock data from a different source and want to analyze it in Mathematica? In my case, I use TradingView platform and there is an option to download the data in CSV format. Besides, I use NSE instead of BSE. In this article, I will show how to use the data from TradingView.
For our discussion, I have downloaded HDFC Life Insurance Co (HDFCLIFE) data of a couple of years from TradingView in CSV format. This contains Open-High-Low-Close-Volume (OHLCV) data. The Time is saved in Unix format.
Here is a function that reads this file and prepares the data for subsequent steps:

Let us load our HDFCLIFE data using this function.

We see that we have slightly over 2 years of data in the file.
Next, we need to convert this data to the format that is compatible with TradingChart[] function. The following two functions do the job. For convenience, one returns just the OHLC data, while the other returns Volume as well.

We are now ready to use the TradingChart[] function:

How about adding BollingerBands to the chart? Quite easy.

For convenience, let us write a wrapper function that loads the data and also displays it:

Here is how we can use it:
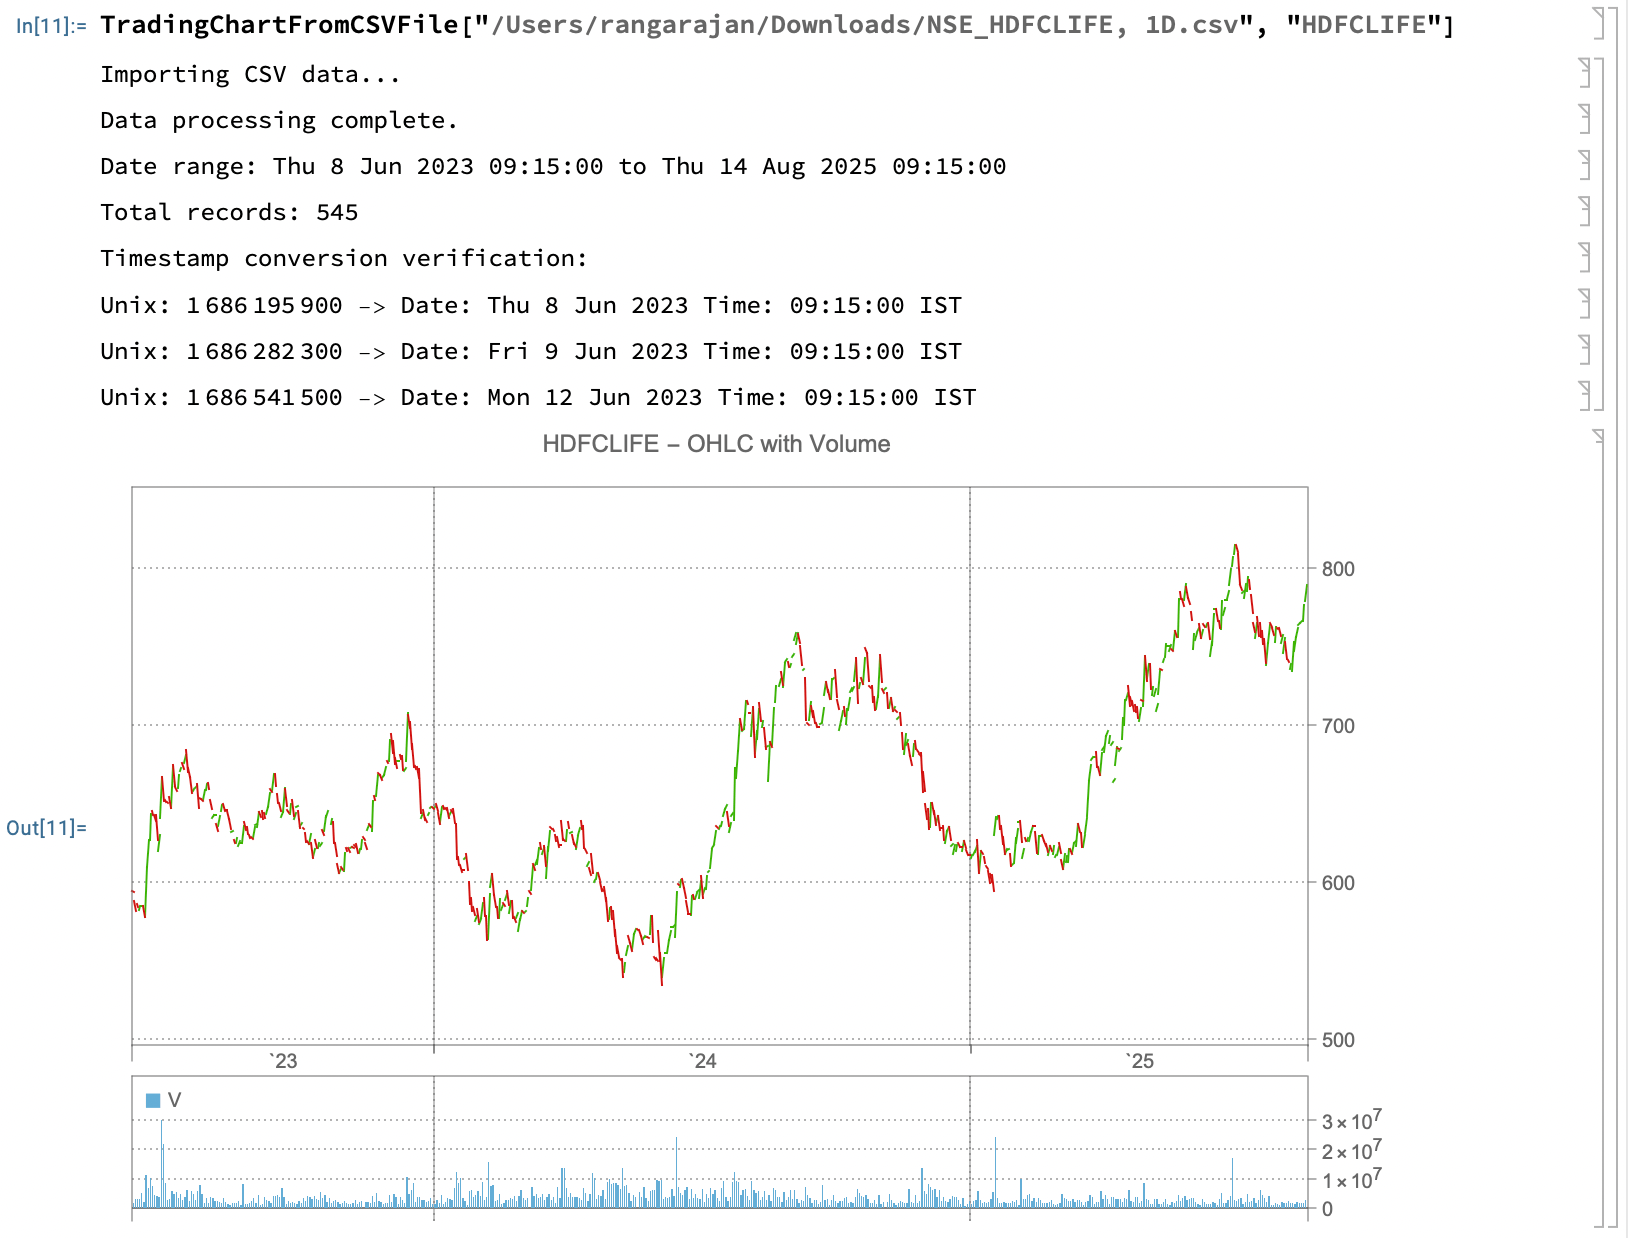
Makes sense, right?
Working with our own data set is a major advantage. Instead of merely rendering the chart, we can optionally take advantage of the advanced numerical and predictive capabilities built into Mathematica.
You can download the CSV data and the source file here.
Have a great week!