Exploring Astronomy with Wolfram Mathematica
As a student of astrology and who has written software for Krishnamurti Padhdhati (KP) System, I am fascinated by astronomy. We all know that there is a deep computational connection between astronomy and astrology. Every astrological system — Western tropical, Vedic sidereal, KP, Jaimini, Chinese — is ultimately dependent on an ephemeris, and ephemerides are pure astronomy. Planetary longitudes, the ascendant calculation, house cusps, lunar node positions (Rahu and Ketu are just the Moon’s ascending and descending nodes), eclipses, retrogrades — all of these are outputs of orbital mechanics.
For exploring the field of astronomy, I can’t think of a better tool than Wolfram Mathematica. I have written several articles on this tool. In today’s article, I want to cover some of the basic ideas from Mathematica in the context of astronomy.
AstroPosition: Where is it, right now?
The simplest astronomical question we can ask is “where?” Where is the Moon? Where is Jupiter? These are answered quite easily. See the interaction below:
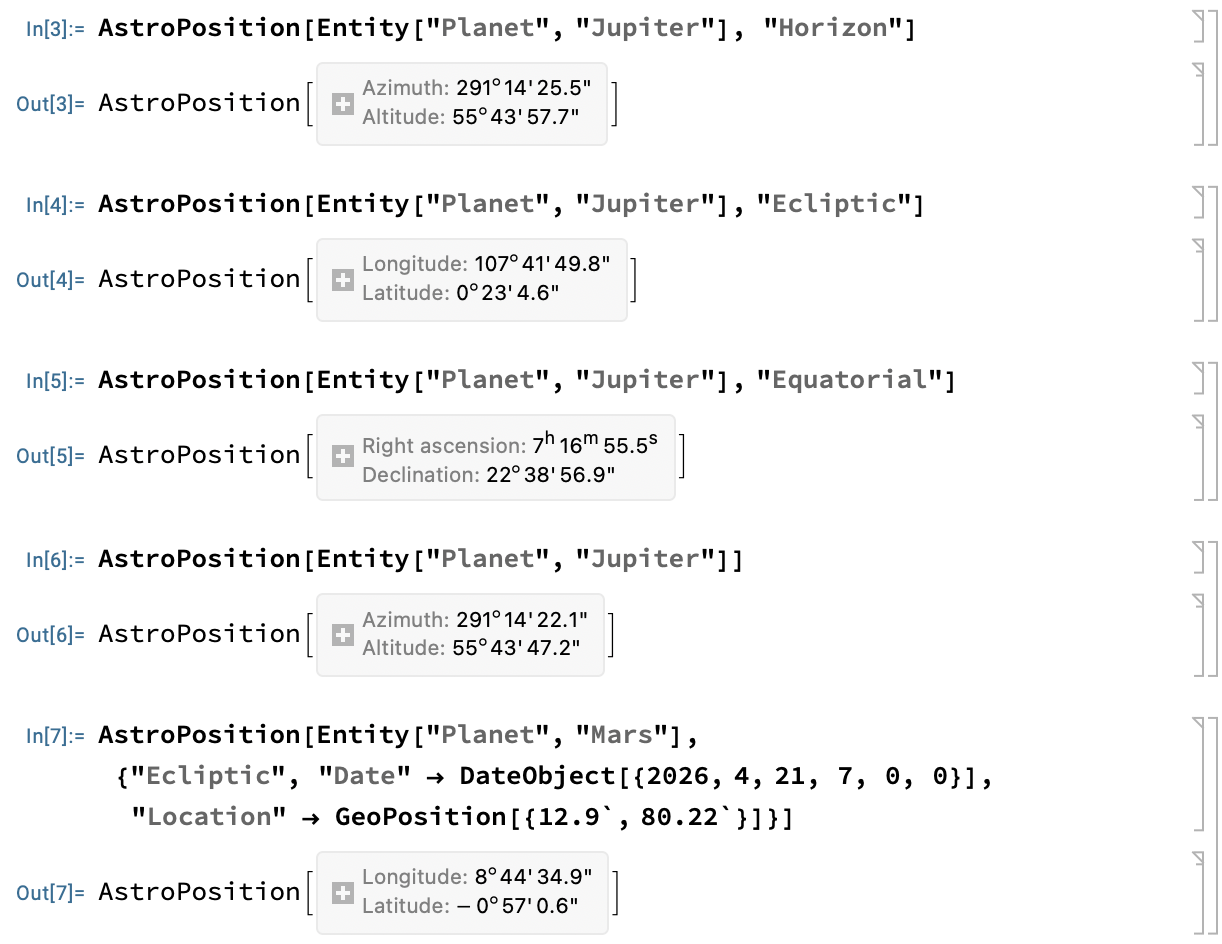
The parameters “horizontal”, “Ecliptic”, and “Equatorial” are different frames of reference. We can also specify the location as well as date as needed. The first time we evaluate these functions, Mathematica automatically downloads the ephemeris data.
We have all heard of the “Great Conjunction” that happened in December 2020. Let us check that!

AstroFindEvent: When did it happen?
There are several functions to find the exact dates on which planetary events happen, for example, Rising, Setting, New Moon, Full Moon, Eclipses, etc.

As you can see, we can even specify dates (after which the event happens) and the geographical location of view point.
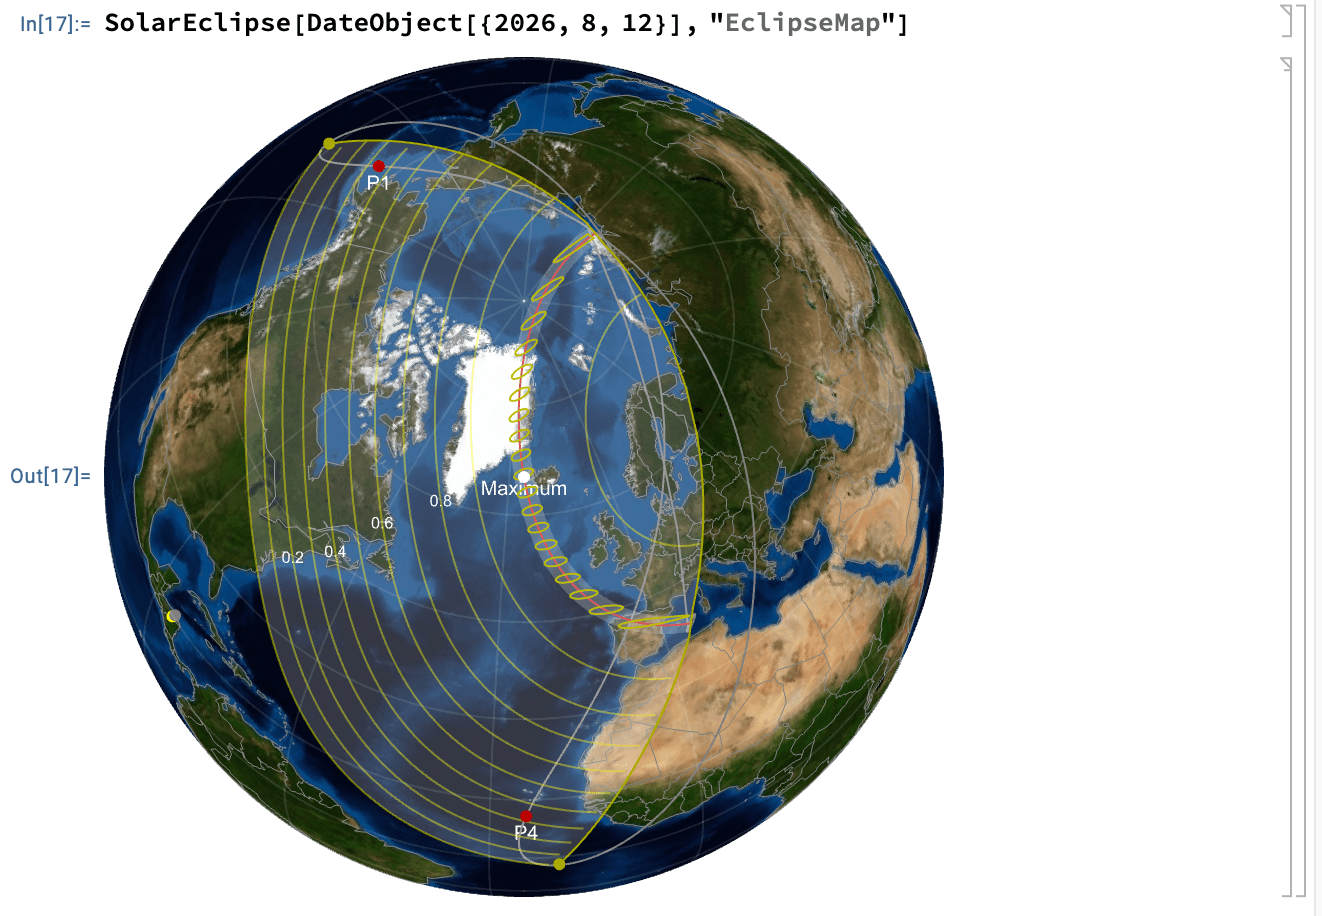
Talking of eclipse, we can even draw a corresponding map!
AstroGraphics: What does it look like?
Just as the eclipse map above visually shows the elements of the eclipse, Mathematica has a function that acts as a “window” to the celestial sphere. Let us look at some examples.
The easiest is to view a map of the current sky. Here is how:

A slightly more interesting example is to render the weekly movement of Sun. Take a look the the following:

In addition to AstroGraphics[] function, we also have GeoGraphics[]. The following shows Solar eclipse over a period of time:

Of course, there is a lot more that we can do with Mathematica. It is definitely magical that with very minimal coding we are able to understand so much of astronomical phenomena! Take your time to experiment.
For today’s article, I have used Mathematica ver 14.3. Incidentally, what I have discussed is just a fraction of what is available in the software.
You can download the Notebook here.